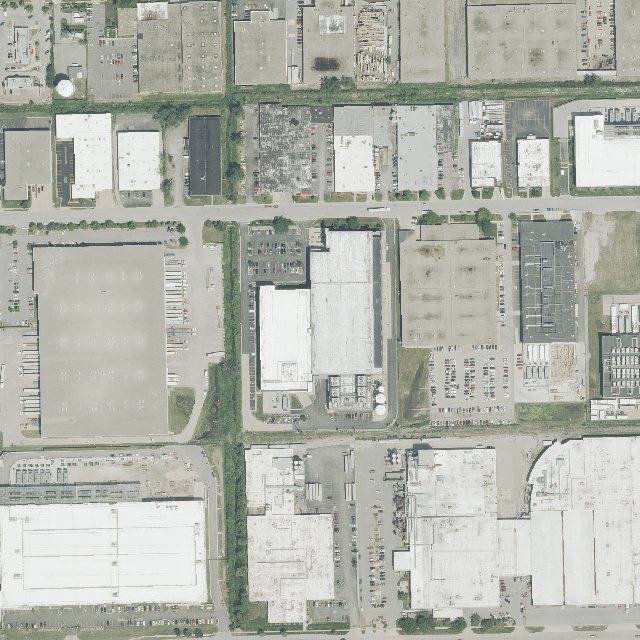
Tracing the physical footprint of a digital world.

Where are data centers being built? How much power and water do they use? What do they change? Earth Genome and EPIC are bringing people, public records, and satellite imagery together to answer these questions and develop ways to track the buildout, starting in Illinois.

Illinois

Starting with Illinois

Our Illinois case study brings together facility inventories, historical imagery, land-cover data, and permits. It explores where data centers are being built, how their sites have changed, and what public records can tell us about their impacts. The six sections present the findings and the questions that remain.

01· Discovery

Building a more complete map

We combined three sources with different purposes. PNNL’s IM3 atlas maps building footprints. FracTracker tracks projects and their development status. The EPA’s NAICS 518210 registry identifies businesses classified as data processing and hosting, which may not correspond to a facility footprint. Comparing these sources reveals gaps that imagery can help investigate.
Sites across three public inventories
0
Appear in only one source
0
Proposed or under construction
0

Searching statewide imagery

Existing lists capture sites that have already been documented. To look beyond them, we divided Illinois’s 2023 USDA National Agriculture Imagery Program (NAIP) coverage into 2.91 million tiles, each 224 meters across. The imagery has approximately 1-meter resolution.

SkyCLIP represents each tile as an embedding: 512 numbers describing its visual features. We averaged embeddings from known data centers and ranked other tiles by their similarity. To evaluate the search, we withheld each known site in turn and tested whether it could still be found.

Without adjustment, the search recovered 36% of held-out sites in the top 1,000 results. Average similarity scores were close: 0.83 for random tile pairs and 0.86 for data center pairs. Shared visual features across Illinois made the distinctive signals harder to isolate.

ZCA whitening rescales the embeddings to reduce the influence of shared features, without adding labels. This increased recall, the share of known sites recovered, from 36% to 80% in the top 1,000 results.

A text-only query, such as “an aerial photo of a data center,” achieved 36% recall in the top 1,000 results without example images. This suggests a starting point for searches in regions with limited labeled data.

Held-out site recall

80%

Recall in the top 1,000 results: the share of known sites recovered. Median rank: 150. Enrichment: 380× relative to a random ranking.

Leave-one-site-out evaluation across 50 confirmed sites. A site is counted as recovered when a tile within 300 m appears in the top K results.
How image resolution affects discovery

In the top 1,000 results, approximately 1-meter NAIP imagery recovered 80% of known sites, compared with 56% for 10-meter Sentinel-2 imagery. NAIP recovered all hyperscale and large purpose-built sites in the test. Both sources recovered 79% of warehouse-style sites. Combining them added one site beyond those recovered by NAIP alone.

Facility typeNAIP, 1 mSentinel-2, 10 m

Finding sites missing from the inventories

Searches in Earth Index, Earth Genome’s imagery search tool, identified Illinois data centers absent from all three inventories. Each search used a small set of labeled example tiles, followed by human review of the results against NAIP imagery and public records.

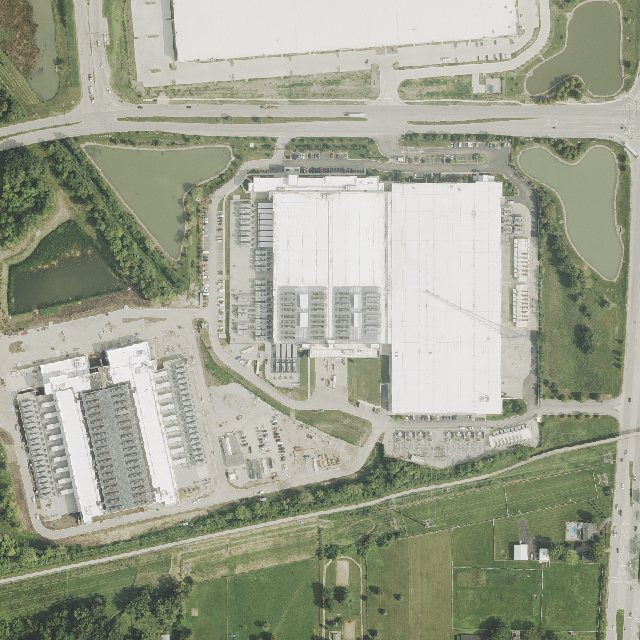
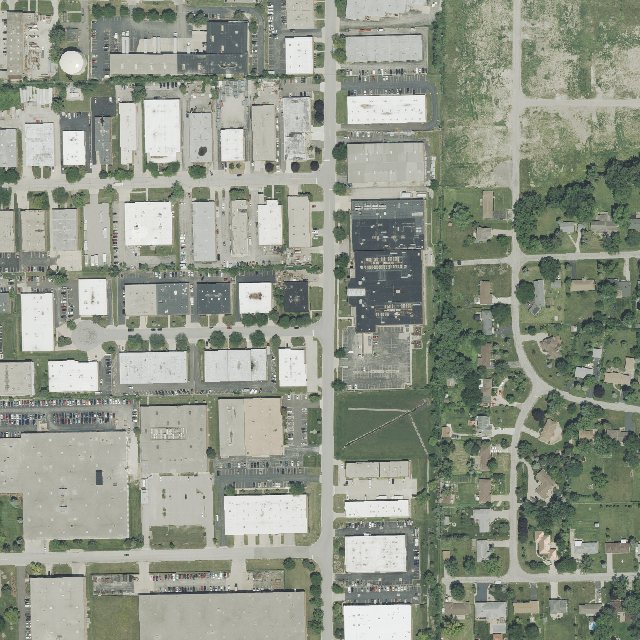
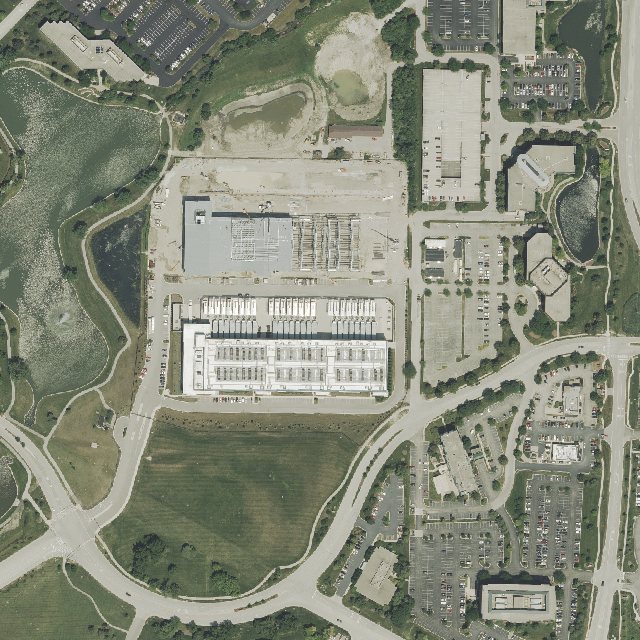
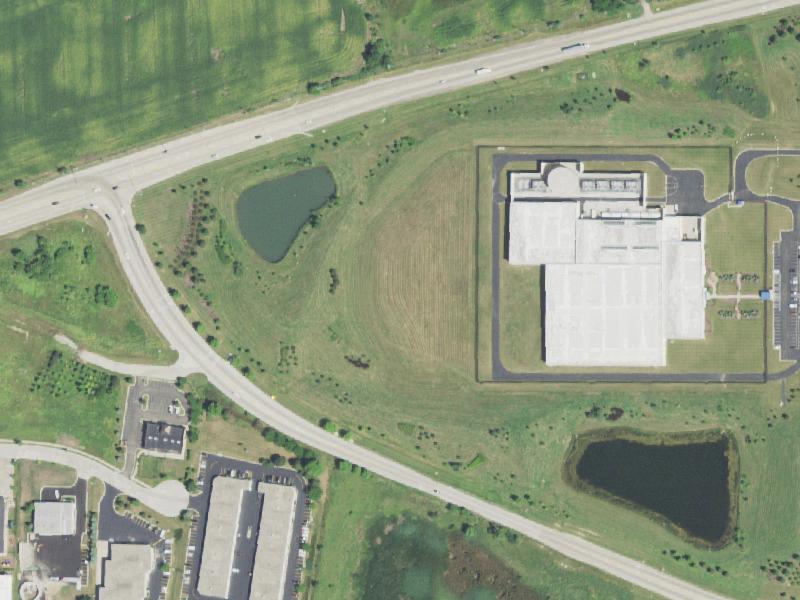
Aerial view of Chirisa Technology ParksAbsent from inventory

Chirisa Technology Parks

Belvidere Rd & Fish Lake Rd, Lake County

A fenced campus with a single data hall and stormwater ponds. It appeared in the first ten search results using four labeled example tiles.

Nearest listed site is 20 km away

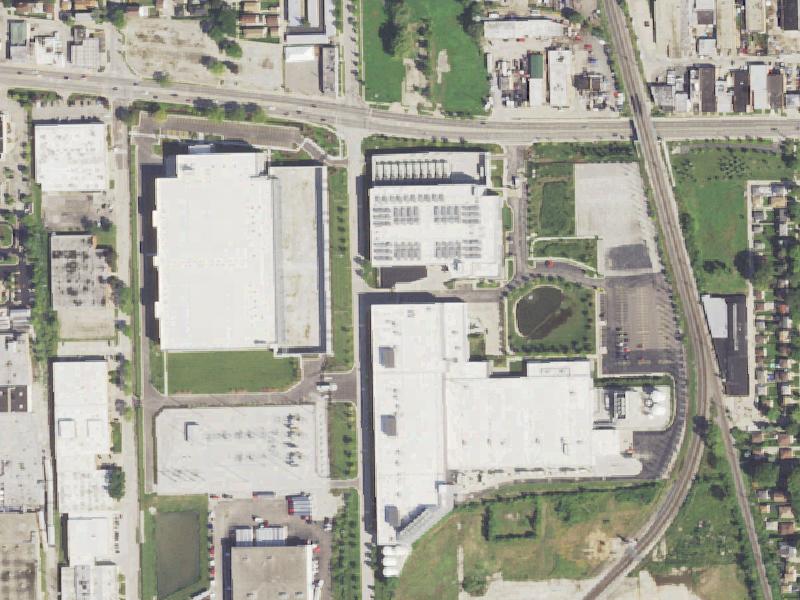
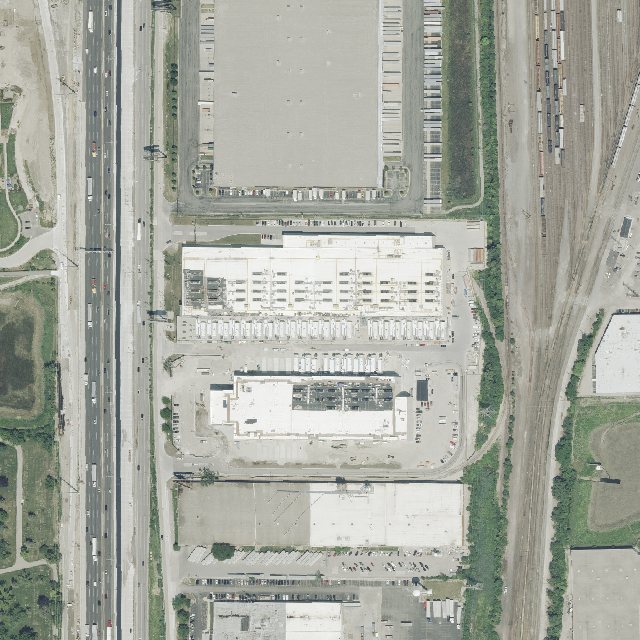
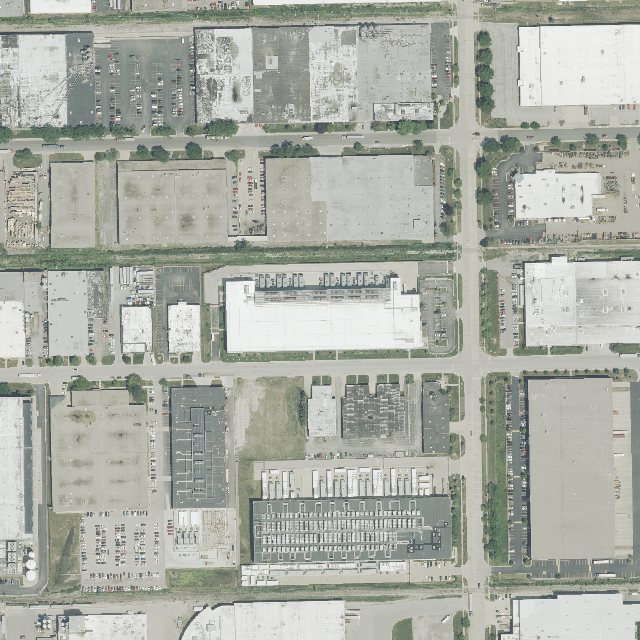
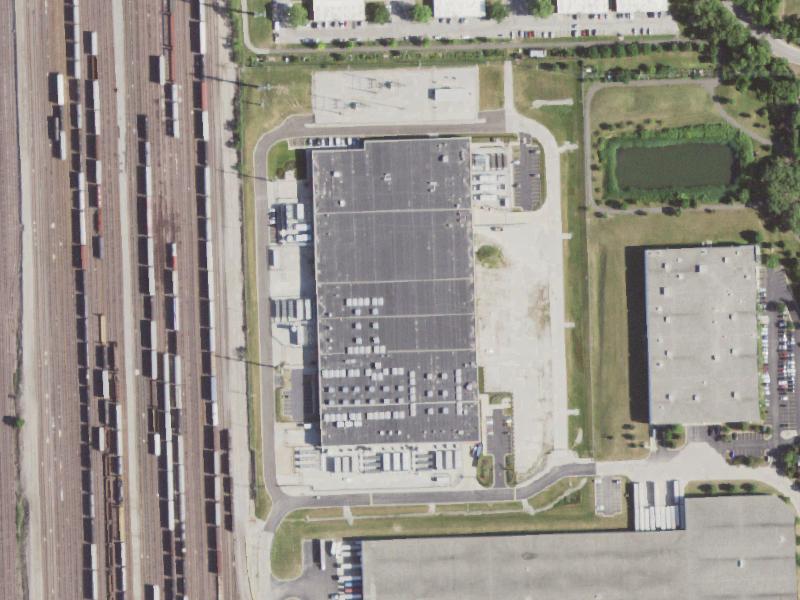
Aerial view of Digital Realty ORD23Absent from inventory

Digital Realty ORD23

N Railroad Ave, Northlake

A dark-roofed data hall near a rail yard, with extensive rooftop equipment, a generator row, and a substation.

Nearest listed site, Aligned ORD-01, is about 0.7 km away

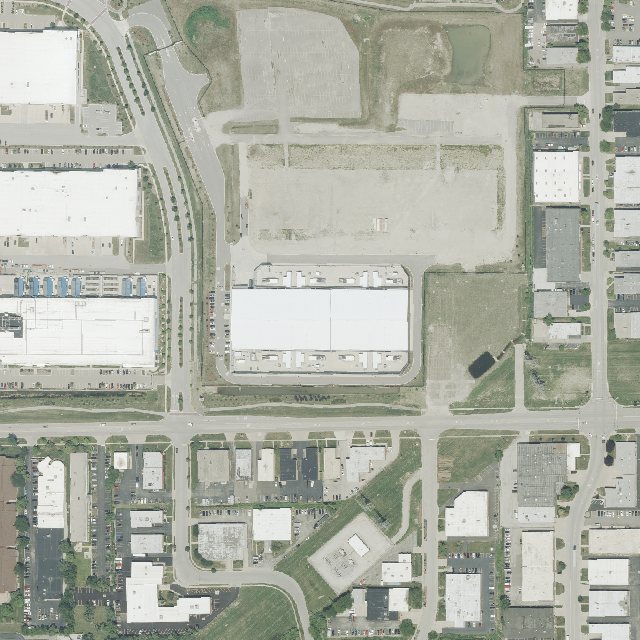
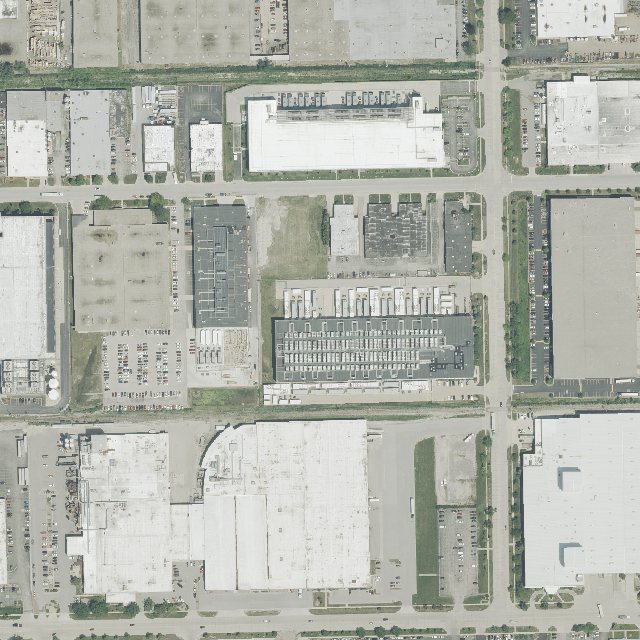
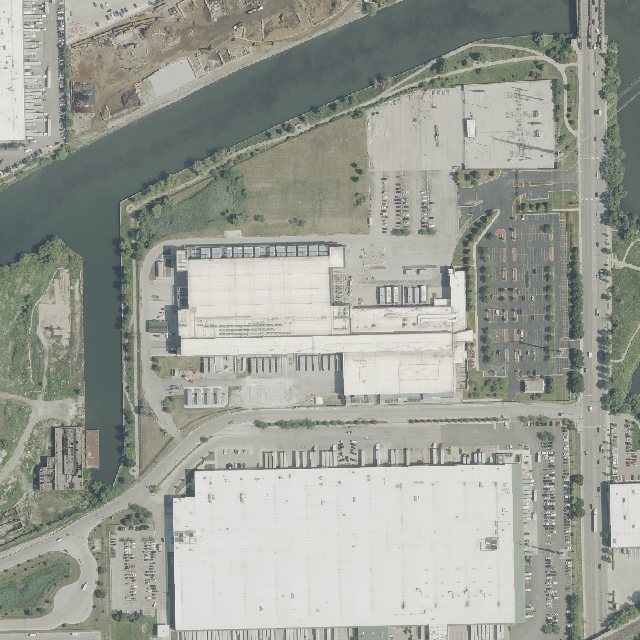
Aerial view of Grand Ave clusterAbsent from inventory

Grand Ave cluster

Franklin Park

Two buildings absent from the three inventories, next to Digital Realty ORD12, which PNNL lists.

Illinois EPA permits identify CHI22 about 240 m away, providing additional evidence for the cluster.

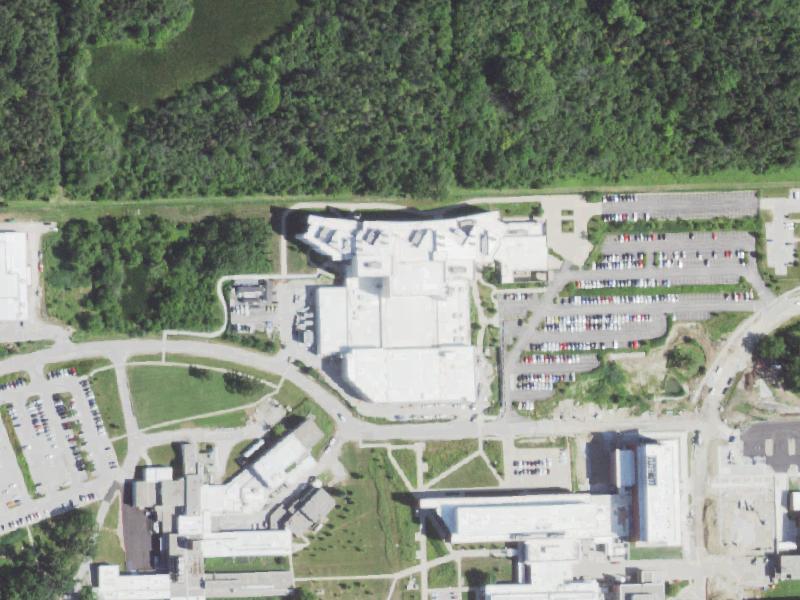
Aerial view of Argonne Theory & Computing SciencesAbsent from inventory

Argonne Theory & Computing Sciences

Argonne National Laboratory, DuPage County

Argonne’s supercomputing building, which houses the Argonne Leadership Computing Facility.

PNNL lists a different Argonne building 1 km away

The review also identified an EdgeConneX facility missing from the inventories. Searches frequently returned electrical substations, which can provide useful context for nearby data centers but do not establish a facility’s identity on their own.

Reviewed in Earth Index. Imagery: USDA NAIP via the USGS National Map. Some facilities were completed after the imagery was captured.

Search results require verification

Recall measures how many known sites a search recovers. Precision measures how many returned results are data centers; we have not yet measured it. Logistics warehouses can rank highly because they resemble colocation facilities, making human review essential. About one in five known sites was not recovered by the NAIP search at this threshold. Permits and registries remain important for facilities with limited visible features, including urban carrier hotels and small edge sites.

02· Anatomy

Recognizing different facility types

We grouped confirmed Illinois sites into seven types based on their appearance in overhead imagery. The classification helps explain which facilities are easier to find and what they may be confused with. Large campuses have distinctive infrastructure, while warehouse-style colocation facilities and urban carrier hotels can resemble surrounding buildings.

01 / 07Hyperscale greenfield campus

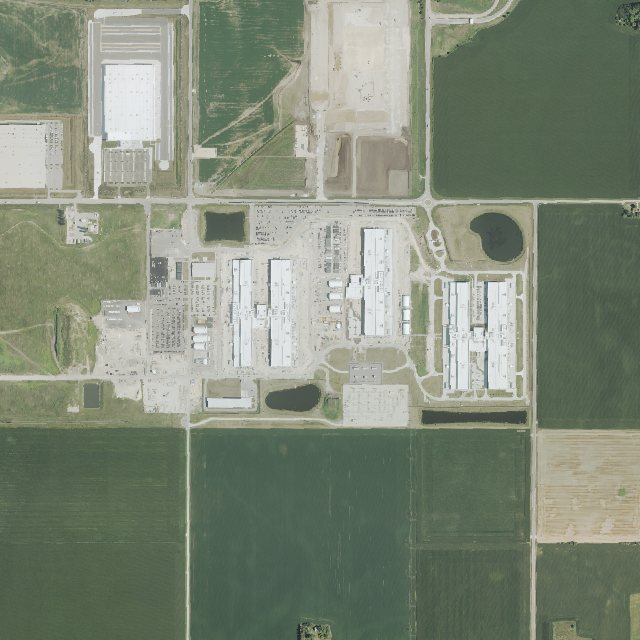
Aerial view of Meta, DeKalb2 sites in IllinoisMeta, DeKalb · 1.9 km across

01

Hyperscale greenfield campus

Rows of large data halls on a secured campus, often with graded land reserved for later phases.

Can resemble a distribution hub. Key indicators include a dedicated high-voltage substation and limited truck-loading infrastructure.

data hallsubstationtransmission linestormwater pondring road

Sentinel-2 · high

NAIP, 1 m · very high

Relative visibility of each facility type in 10-meter Sentinel-2 and approximately 1-meter NAIP imagery. Longer bars indicate stronger visible features, rather than measured recall.

Imagery: USDA NAIP at approximately 1-meter resolution, via the USGS National Map.

03· Facilities

Tracing campus development

We linked 23 hyperscale, large purpose-built, and warehouse-style colocation campuses to parcels and historical imagery. Use the divider to compare conditions before construction with NAIP imagery from 2023 or Sentinel-2 imagery from 2026. Differences in image resolution affect the detail visible in each comparison.

04· Land

Understanding land-use change

Northeast Aurora provides a detailed view of the buildout. Three nearby campuses occupy land with a history of agriculture, and two recent projects replaced active cropland. Imagery spanning twenty years shows how these sites progressed from fields to construction and completed buildings.

Prior land use varies across campuses

Of the 23 campuses assessed, 18 were classified as previously developed sites, such as factories, warehouses, or existing data centers. The remaining sites included cropland or pasture, woodland and wetland, a brownfield, and former farmland later prepared as an industrial park. These categories provide context for evaluating each development’s land impacts.

Previously developed23 campusesOther prior uses

  • 18Previously developed
  • 1Brownfield
  • 1Farm, then industrial park
  • 2Cropland or pasture
  • 1Woodland and wetland

Different landscapes, different impacts

The two hyperscale campuses replaced different landscapes. Meta’s DeKalb campus developed former row cropland in phases. Microsoft’s Hoffman Estates campus replaced a mix of pasture, old field, woodland, and wetland. Estimated tree cover at Hoffman Estates fell from 62% in 2019 to 5% by 2021.

The land-cover datasets captured this change differently. NLCD did not capture the rapid tree-cover loss reflected in Dynamic World’s 10-meter Sentinel-2 classification. Comparing multiple datasets and imagery provides more detail than a single “greenfield” designation.

Tree cover, Hoffman Estates, 2019
0%
Tree cover by 2021
0%

This analysis does not yet include a statewide assessment of wetlands and floodplains.

Measuring the wider site footprint

Building area captures only part of a campus footprint. Roads, parking, substations, generator yards, and other built surfaces also occupy land.

Across 21 campuses with mapped roofs, roof area totals 121.7 acres. The satellite-derived built-surface estimate totals 742.8 acres, approximately 6.1 times the mapped roof area.

Built surface is estimated from 10-meter satellite imagery from 2026 and can include adjacent development. Excluding campuses with that overlap reduces the ratio to approximately 5×.

Built surface versus mapped roofs
0×

121.7 acres of mapped roofs; 742.8 acres of estimated built surface.

05· Impact

Assessing backup power infrastructure

Illinois EPA records document substantial permitted diesel generator capacity at data centers. About 41% of the recovered nameplate capacity is associated with addresses in the Elk Grove area. These records show the scale and concentration of backup infrastructure; they do not measure electricity demand, operating hours, or actual emissions. Zoom to Elk Grove to explore the distribution.
Generators documented
0
Minimum nameplate capacity
0 GW
Capacity in the Elk Grove area
0%

Elk Grove-area address Elsewhere

From facility permits to regional questions

Nameplate capacity describes a generator’s rated output. It does not indicate how often the generator runs or how much pollution it emits. The reviewed permits set annual operating limits of roughly 180 to 1,200 hours for testing and outages. Multiple facilities could operate generators during the same outage or grid emergency, making the timing and combined effects of operation important questions for further analysis.

Of 73 final air permits in the collected records, 22 are dated 2024 or later. These recent approvals provide evidence of continued permitting activity, rather than a direct measure of installed or operating capacity.

Generator totals were extracted from 24 unique Illinois EPA records using optical character recognition (OCR). Aligned ORD-01 and ORD-02 share one record and are counted once. Two of 41 generator groups were checked manually. Generators without a recovered kilowatt rating contribute zero to the capacity total, making 1.26 GW a minimum estimate.

Allegations documented in state agreements

3

Late annual emissions reports alleged for Equinix, CyrusOne in Aurora, and Ensono.

2

Instances in which Equinix generators G7–G10 allegedly exceeded limits for carbon monoxide (CO) and volatile organic material (VOM).

1

Alleged failure to provide a required notice within 30 days.

1

Allegation that Stream installed four generators before obtaining a construction permit.

These allegations appear in signed state agreements and are not presented as court findings. Comparing historical imagery with permit dates could help investigate construction timelines, subject to image availability and resolution.

Building the evidence on water

We do not yet have enough evidence to quantify facility water use. Water-discharge permits were collected alongside the air permits but have not been analyzed. Imagery can identify cooling infrastructure, stormwater ponds, and changes in built surface, providing context for further investigation.

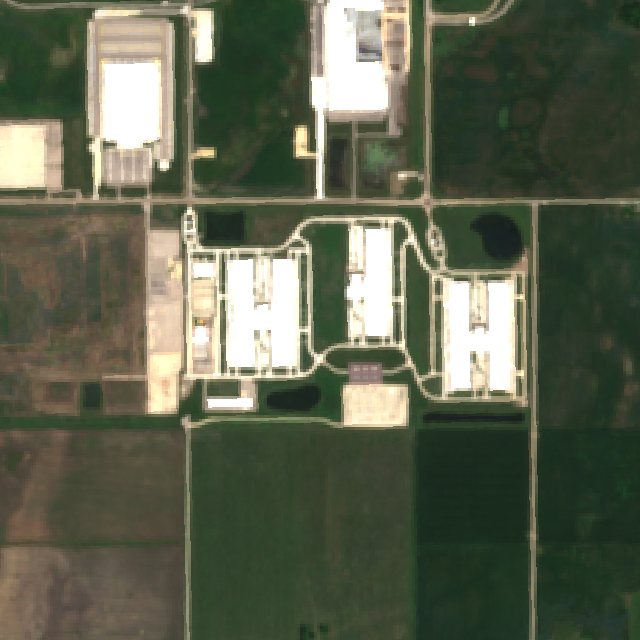
Sentinel-2 2026 image of Meta’s DeKalb campus showing geometric stormwater retention ponds
Meta’s DeKalb campus in Sentinel-2 imagery, 2026. Stormwater basins are visible around the development.
7

Water-discharge permits

Seven National Pollutant Discharge Elimination System (NPDES) permits have been collected but not yet converted to searchable text or analyzed. They may provide evidence about permitted discharges, though they do not directly measure water consumption.

◎

Cooling infrastructure

Imagery reveals rooftop chillers, cooling towers, and screened cooling yards. These features may help characterize cooling systems, but estimating water use requires technical information and operating data.

≈

Stormwater and built surfaces

Roofs, roads, and paved yards can change runoff patterns. Visible stormwater ponds and built-surface estimates provide a basis for investigating site drainage.

⌇

Wetlands and woodland

At Hoffman Estates, estimated tree cover fell from 62% to 5% on a site that included wetland. A statewide wetland and floodplain assessment would help establish the extent of these changes.

06· Methods

Sources, methods, and limitations

The findings combine public records, imagery, and derived estimates. These notes explain how each source was used, how the search was evaluated, and where further verification is needed.

Location inventories

We matched three public inventories: PNNL’s IM3 building atlas (9 February 2026), FracTracker’s project tracker (29 January 2026), and the EPA’s NAICS 518210 business registry (7 May 2026). Records within 100 meters were treated as one site, or within 1 kilometer when the name and operator agreed. Conflicting facility codes were kept separate. The sources describe different aspects of a facility, including its footprint, development status, and business classification.

Embedding retrieval

SkyCLIP generated embeddings for 2.91 million tiles from 2023 NAIP imagery at approximately 1-meter resolution. SSL4EO generated embeddings for 4.69 million chips from 2024 Sentinel-2 imagery at 10-meter resolution. We ranked results by cosine similarity after whitening reduced the influence of shared features. In leave-one-site-out evaluation across 50 known sites, the NAIP search achieved 80% recall in the top 1,000 results. Precision has not been measured.

Land-use change

We assessed conditions before construction using Dynamic World land-cover estimates from 2016 to 2026, national crop and land-cover datasets, and historical imagery. Detailed human review was completed for Aurora. Statewide classifications remain preliminary.

Regulatory records

We collected 112 Illinois EPA permit files covering 25 facilities and used OCR to extract text from 1,181 scanned pages. Generator totals were derived from 24 unique records. Nameplate capacity represents rated output rather than operating hours or emissions. Missing ratings contribute zero to the total, making 1.26 GW a minimum estimate.

Measuring site area

We distinguish mapped roof area, satellite-derived built surface, and construction disturbance. Built surface includes structures and associated paved or developed areas at 10-meter resolution. Disturbance captures land cleared or graded during construction. Each measure describes a different aspect of the footprint.

Scope and limitations

This is an Illinois case study through September 2026, rather than a national census. Permit records cover 25 facilities. Building outlines may be outdated, imagery search can return ordinary warehouses, and statewide land-use classifications require further review. Actual electricity demand, water consumption, and emissions have not been established.

Collaborate

Work with us to build a clearer picture

We are developing approaches to locate data centers, track their development, and investigate their impacts. We welcome partners with relevant data, local knowledge, research questions, or regions to explore. Help us connect the evidence, close data gaps, and expand beyond Illinois.

Connect the evidence

Help develop shared fields and identifiers that connect facility inventories, imagery, and permits to the same sites.

Close the data gaps

Contribute records and local knowledge to clarify water use, electricity demand, operating status, and wetland impacts.

Expand beyond Illinois

Work with us to apply and test these methods in other regions, using local records, imagery, and expertise.

Your note is emailed to Earth Genome. Replies go to the address you enter.